The feature that made VisuAlg famous in classrooms is its visual execution. You can watch the program run line by line while every variable updates beside the code. Learning these tools turns debugging from guesswork into observation.
Run modes
| Key | Action |
|---|---|
| F9 | Run the whole algorithm |
| F8 | Step by step: run one line, then pause |
| F5 | Toggle a breakpoint on the current line |
| Ctrl+F2 | Stop execution |
Shortcuts can vary slightly between releases; check the Run menu (Executar) in your copy if a key does nothing.
Step by step in practice
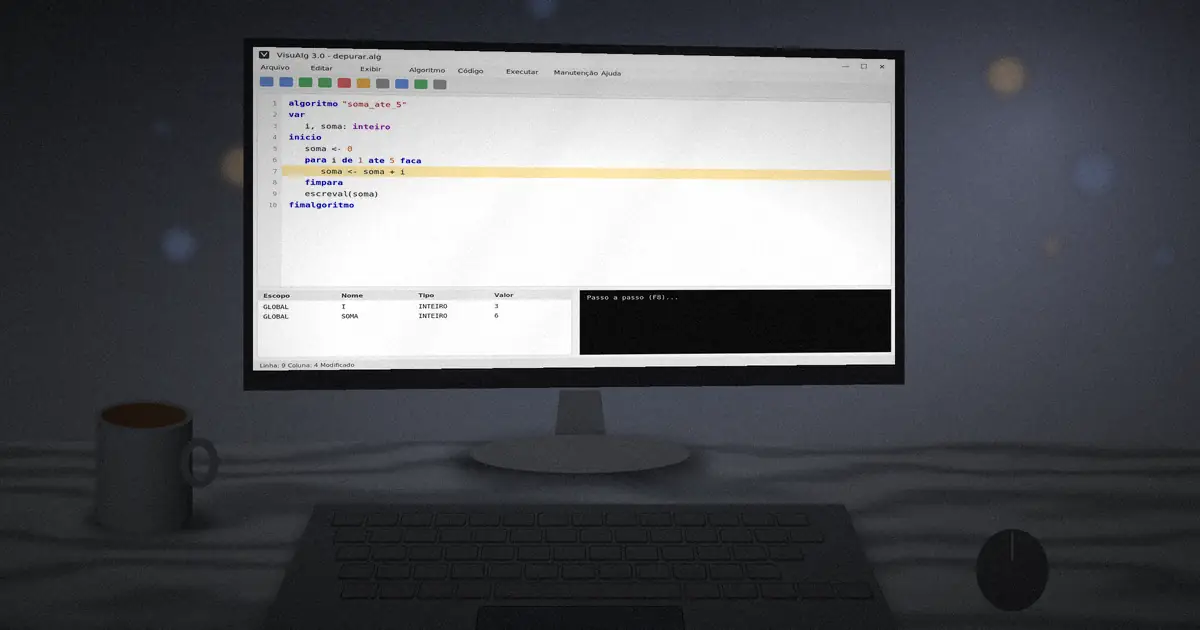
algoritmo "soma_ate_5"
var
   i, soma: inteiro
inicio
   soma <- 0
   para i de 1 ate 5 faca
      soma <- soma + i
   fimpara
   escreval(soma)
fimalgoritmo
Press F8 repeatedly. The current line is highlighted and the variables panel shows SOMA growing 1, 3, 6, 10, 15 while I counts up. If the final value is wrong, you will see exactly which pass broke it.
Breakpoints
In long programs, stepping from the first line is slow. Place the cursor on a suspicious line and press F5 to set a breakpoint. Run with F9 and execution pauses there, then continue with F8.
Timed execution
The timer command and the timed run option slow the program down so you can watch it without pressing keys. It is a great way to present an algorithm to a class.
Reading common errors
- Variable not found: you used a name not declared in
var, or misspelled it. - Incompatible types: you stored a real in an
inteiroor text in a number. - Missing fimse, fimpara or fimenquanto: a block was opened but never closed. Count your openings and closings.
- Index out of range: an array index went beyond its declared size.
Generating test data
Typing input during every test is tiring. Use aleatorio on before leia commands to fill variables with random values, and aleatorio off to return to manual input.
Using a Mac or Linux machine? See how to run VisuAlg on Linux and macOS.